


In Lean Manufacturing, driving continuous improvement across modern product lines relies on the clarity, velocity, and visibility of operational data. Tracking the right manufacturing KPIs (key performance indicators) enables plant managers to maximize overall production efficiency, stabilize the wider supply chain, and empower front-line operators. However, simply running digital data collection into background databases is not enough: to actively engage teams and systematically identify areas for optimization, key indicators must be displayed line-side where value is actually created.
Which Manufacturing KPIs Should You Prioritize on the Shop Floor?
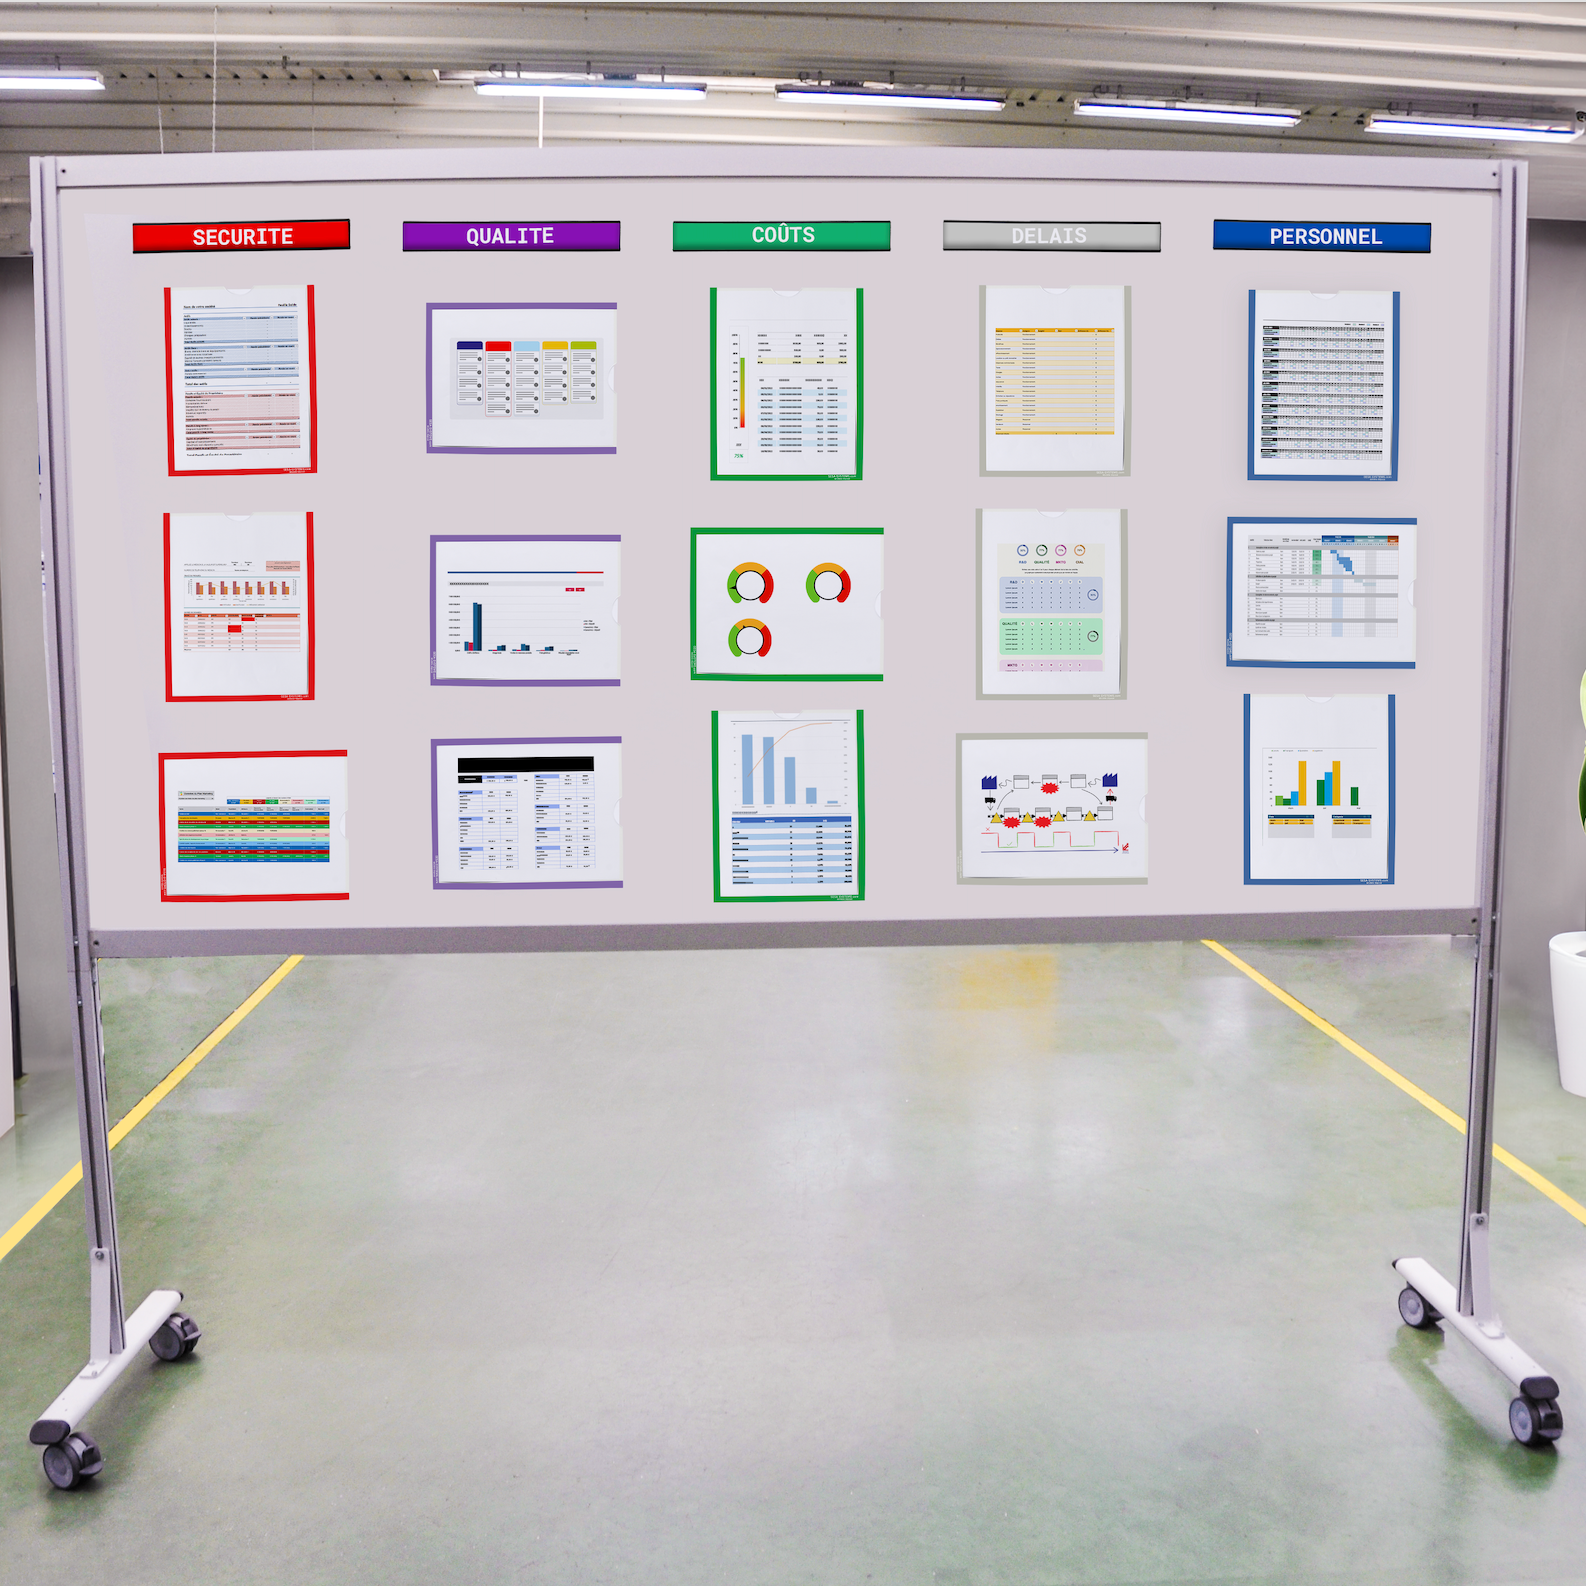
To maintain a balanced overview of plant performance, high-performing facilities structure their operational metrics around the SQCDP pillars (Safety, Quality, Cost, Delivery, People):
- Safety and Ergonomics: Lost-time injury frequency, near-miss logging, and proactive hazard mitigation. A secure, ergonomic environment forms the baseline of sustainable shop floor operations.
- Quality and Material Control: Scrap percentage, supplier non-conformity in incoming raw materials, and the net defect rate. Displaying real-time quality alerts helps operators isolate non-conformances before parts reach the next assembly step.
- Machine Availability and Asset Care: Overall Equipment Effectiveness (OEE / TRS) remains the cornerstone of shop floor benchmarking. Maximizing performance requires balancing run rates against planned downtime, distinguishing between routine scheduled maintenance and proactive preventative maintenance to avert catastrophic stoppages.
- Throughput and Output: Tracking the gross number of units produced against the scheduled plan, evaluating overall capacity utilization, and measuring total time per run—including setup and changeover time (SMED).
- Delivery and Customer Focus: On-Time In-Full (OTIF) shipping performance and lead-time adherence, which directly determine end customer satisfaction.
To integrate these visual standards into your daily shop floor routines, explore our operational guide on Lean methods and best practices.
How to Display Your Indicators Effectively at the Workstation?
An indicator trapped in an enterprise spreadsheet delivers zero immediate impact on daily line cadence. Turning metrics into an engine for rapid root-cause counteraction requires proven visual management practices:
- Display at the Gemba: Install visual boards and communication hubs directly along the line at operator eye level. Front-line workers should assess station stability in less than five seconds.
- Universal Color-Coding: Apply the classic red/green standard. Green signals that current output and quality are on target, while red highlights an abnormal variance that demands prompt team collaboration.
- From Whiteboards to Dynamic Screens: Magnetic shop floor boards remain ideal for physical Short Interval Management (SIM) rituals like Top 5 or Top 15 huddles. For fast-paced environments requiring instant throughput updates, digital displays bridge the gap between MES databases and line operators. To equip your cells with industrial-grade dynamic displays, discover our dedicated range of digital visual management solutions and interactive screens.
Bringing Operational Indicators to Life Every Day
Line-side visual tracking transforms operational culture: communication shifts from top-down reporting into collaborative problem-solving on the plant floor. By combining automated data collection with visible manufacturing KPIs, industrial plants gain the clarity needed to cut waste, elevate production efficiency, and sustain peak competitiveness across every stage of production.


